Swing Trade With MACD And RSI

MACD and RSI—what are they?
The Moving average convergence/divergence (MACD) is an oscillator commonly used to determine the momentum of a trend or identify a potential trend reversal.
The Relative Strength Index (RSI) is a momentum oscillator that measures the speed and size of price changes, which is widely used to identify overbought and oversold levels.
How can MACD help your trade?
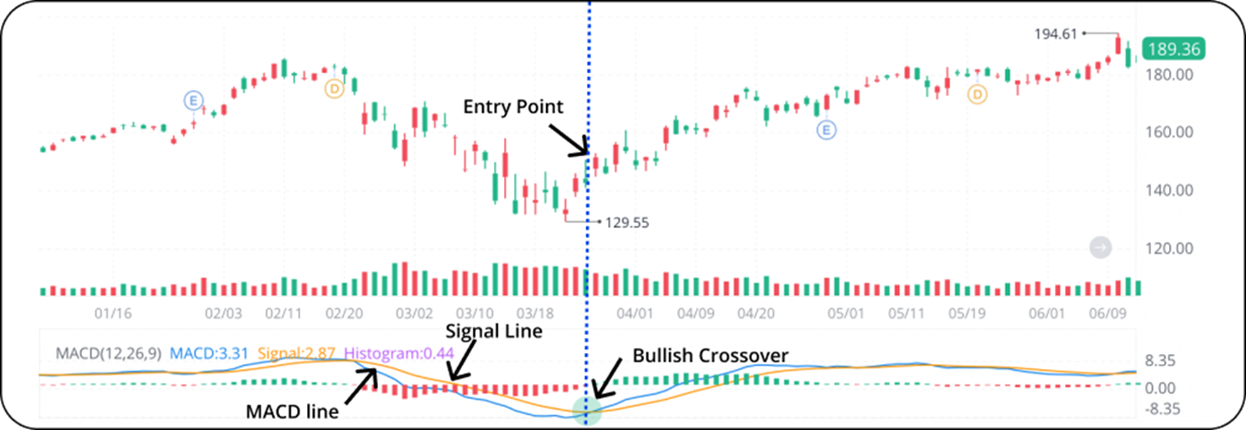
When the MACD line crosses above the signal line, it’s considered a bullish signal. It indicates that the price may change direction.
In the example below, the stock price climbs up after a long downtrend that lasts for a month. Shortly afterward, the MACD line crosses above the signal line, forming a bullish crossover. Investors may open a long position here to profit from the potential uptrend.
How can the RSI help your trade?
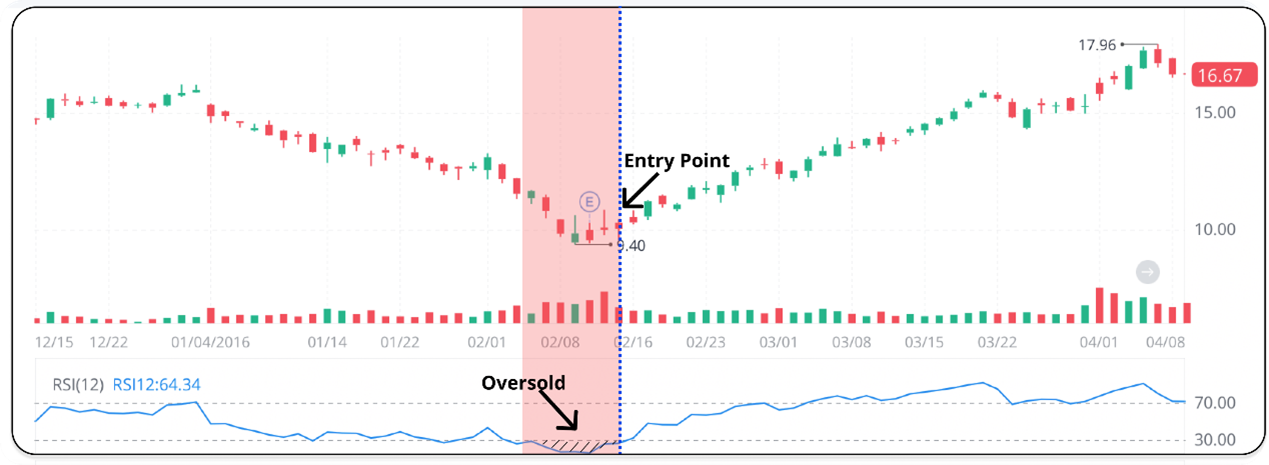
When the RSI climbs above 70, the security is considered overbought. When the RSI drops below 30, it is considered oversold.
In the example below, the RSI drops below 30 after a long downtrend. It stays in the oversold area for a few days, indicating that the downside momentum is strong. When the RSI climbs back to 30, an uptrend may pick up. This can indicate a good time to buy the stock, as it usually means the oversold period is ending.
Is it a better move to combine MACD and RSI?
While both MACD and RSI can be useful in identifying price reversals and trend momentum, they have their own limitations.
- MACD measures past price changes, so it tends to be late in giving signals.
- When unexpected spikes and lags in volume occur, RSI may provide false trading signals.
By combining RSI and MACD, swing traders can make the most of these two indicators. A bullish/bearish signal confirmed both by RSI and MACD can be more accurate and reliable than just one or the other.
How to combine MACD and RSI
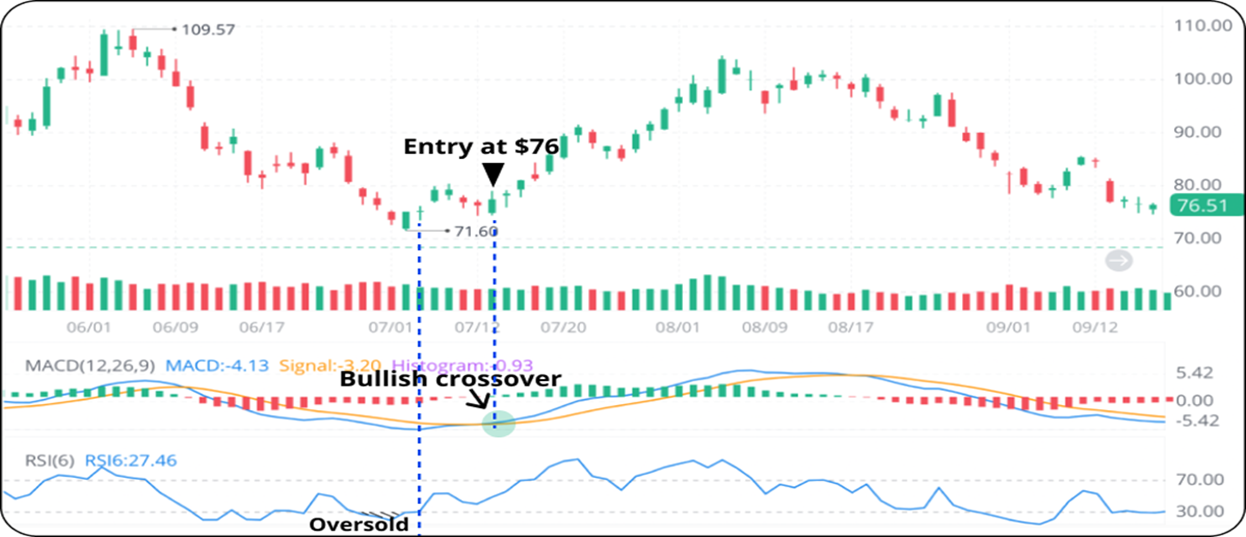
Convergence between the MACD and RSI: Confirmation
In the example below, the RSI drops below 30 after a downtrend and stays in the oversold area for a few days. A bullish signal is generated when the RSI rises above 30. Fearing that the uptrend momentum may be weak, swing traders may wait to see if the MACD line will rise above the signal line.
When a bullish crossover does appear in MACD, the strength of the uptrend should be confirmed. Swing traders may decide to enter a long position.
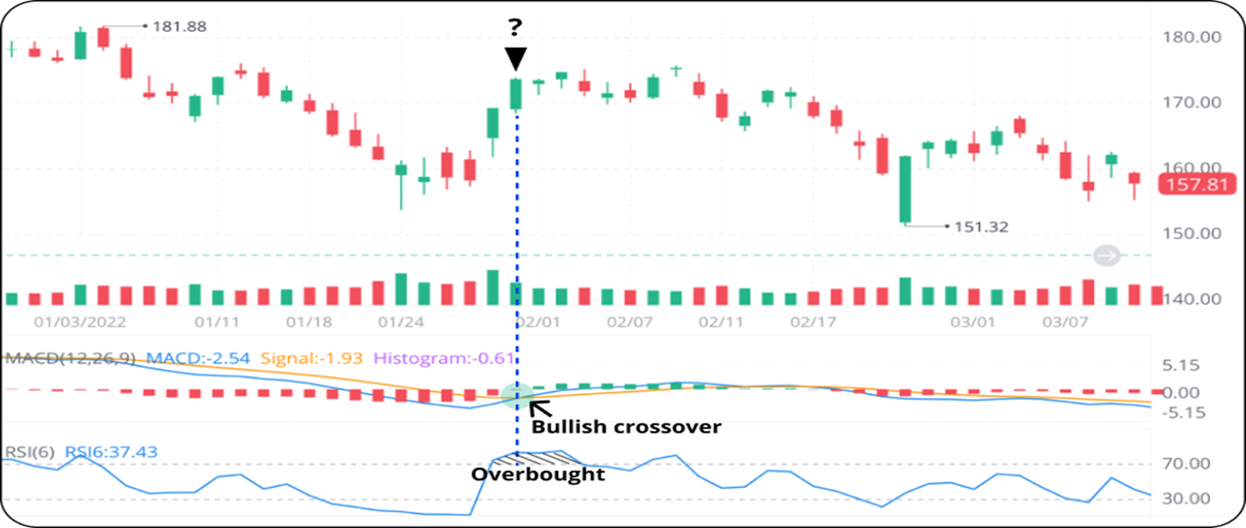
Divergence between the MACD and RSI: Alert
It might not be a good time to enter a position when MACD and RSI diverge.
In the example below, a bullish crossover is formed in MACD, indicating an uptrend. However, the RSI is in the overbought area, far away from the oversold level. It’s possible that the uptrend is nearing an end. Swing traders may choose not to take the risk and wait for another entry.
The Bottom Line
Since no indicator is 100% accurate, combining MACD and RSI can help swing traders maximize the value of the two. With technical analysis, using several indicators at once can simplify decision-making. Don't forget to test your strategy in paper trading first!
Source: https://www.webullapp.com/learn/1k79fn/553Fb2/Swing-Trade-With-MACD-And-RSI?sourcePage=InvestEducationLessonDetail
*All trading symbols displayed are for illustrative purposes only and are not intended to portray recommendations.

All Comments